Systematic Covariance Envelopes from Wasserstein Geometry: Evidence from Language-Model Representations
Quadratic Wasserstein geometry turns distributional separation into sharp conditional bounds on attainable systematic covariance under explicit information-to-exposure restrictions.
Abstract
Firm characteristics are often represented as fixed vectors even when evidence about firms arrives as heterogeneous collections of articles and reports. This paper instead represents each firm by a probability law and asks what the distance between two such laws can restrict about systematic covariance.
For fixed latent exposure laws, quadratic Wasserstein geometry gives sharp covariance endpoints over admissible couplings. Under a common randomized bi-Lipschitz characteristic-to-exposure map, bounded risk-coordinate slack, and a maintained return-covariance bridge, observable characteristic-side distance yields a conditional interval for the covariance ceiling.
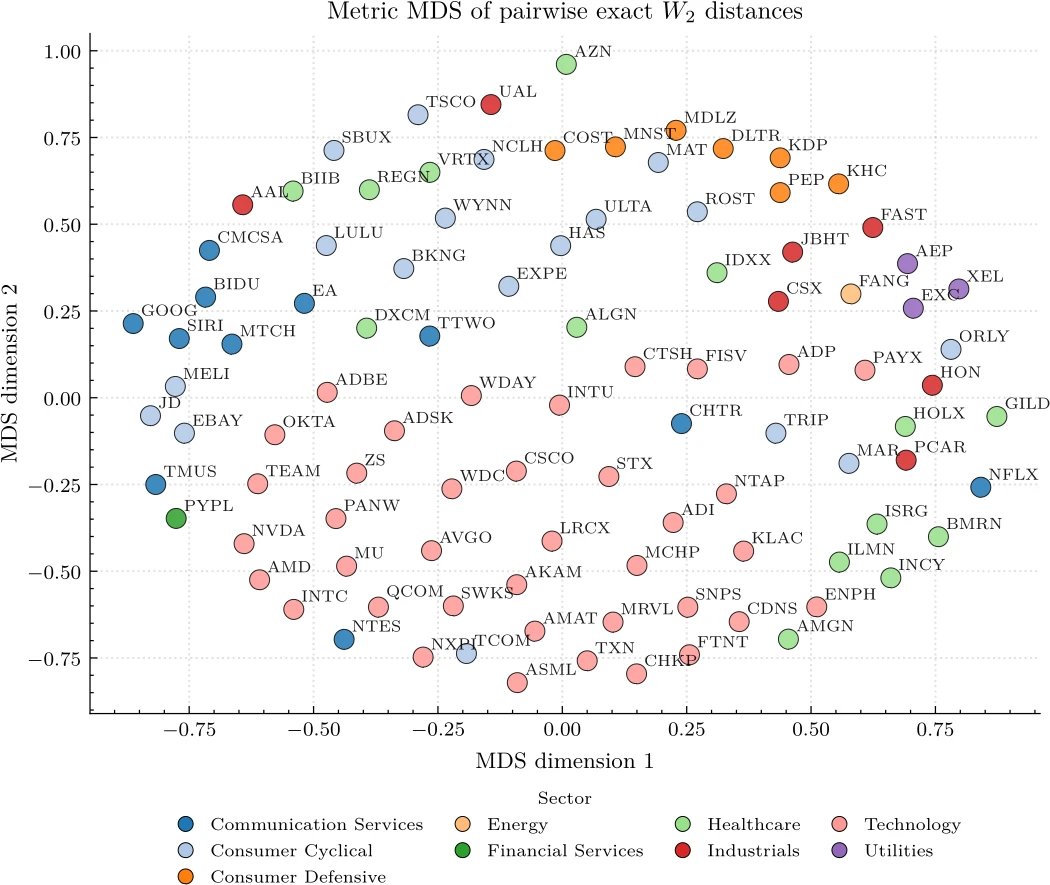
Reading the map
The plot shows broad economic neighborhoods rather than perfectly isolated sectors. Figure 1 shows 100 firms in two-dimensional metric MDS coordinates computed from the exact pairwise Wasserstein-2 distances between their capped 128-article representations. The axes are unitless projection coordinates; colors identify the Nasdaq summary sector.
Technology firms form the clearest concentration in the lower half. AMD, NVDA, INTC, MU, QCOM, and equipment makers such as AMAT, LRCX, and ASML sit in the same broad region. Consumer Defensive names including PEP, KHC, KDP, and DLTR form a second upper-right pocket. These patterns are consistent with shared language about products, inputs, customers, and demand conditions, but the plot alone cannot identify which channel matters.
The exceptions are especially useful for an economic reader. AAL and UAL are both airlines classified as Industrials, yet they sit far apart. AZN is a high Healthcare point above the main Healthcare cloud. Those positions invite concrete questions: do route, fleet, labour, and geographic news separate the two carriers? Does AZN's product mix or international clinical footprint give its articles a different distribution? The geometry proposes these questions; it does not answer them.
The underlying checks support a cautious reading. In the original distance matrix, sector labels account for about 15.3% of total distance dispersion, and every multi-firm sector has lower mean within-sector W2 than cross-sector W2. MDS is lossy: its stress is about 0.433, and it preserves the exact nearest neighbour for only 16 of 100 firms. Use visible proximity as global orientation, not as a peer-selection rule. The axes can rotate or reflect, and the original Wasserstein-2 distances, not these approximate coordinates, remain authoritative for the paper's statistics and pair selections.
Mathematical sequence
- Replace one point-valued firm characteristic with a probability distribution over information positions.
- Map characteristic draws into latent systematic exposures in Hilbert risk coordinates.
- Hold the two exposure marginals fixed and vary their admissible joint couplings.
- Use polarization to convert expected squared displacement into expected inner-product alignment.
- Minimize quadratic transport cost to obtain the greatest attainable covariance; reflect one marginal to obtain the lower endpoint.
- Transfer an observable Wasserstein-distance bracket through the maintained distortion and slack restrictions.
The covariance envelope
For covariance-weighted exposure laws, the upper endpoint has the form
κ̄ᵢⱼ = ½(vᵢ + vⱼ − W²₂,Γ(Pᵢ, Pⱼ)).
Any realized coupling satisfies
κπ = κ̄ᵢⱼ − ½Δπ, with Δπ ≥ 0.
The nonnegative transport-excess term measures how much the realized arrangement exceeds the minimum transport cost and, equivalently, how far realized covariance lies below the ceiling.
Why it matters
The result is an envelope rather than a covariance estimate. It shows how probability-valued information can rule out some systematic dependence configurations while keeping the observable information law, latent exposure law, and realized return process conceptually separate.